
The impact of time on non-covid deaths in younger vaccinated adults
The impact of time on non-covid deaths in younger vaccinated adults

In my previous post I described how there appear to be significantly more deaths after vaccination in younger adults than you’d otherwise expect.
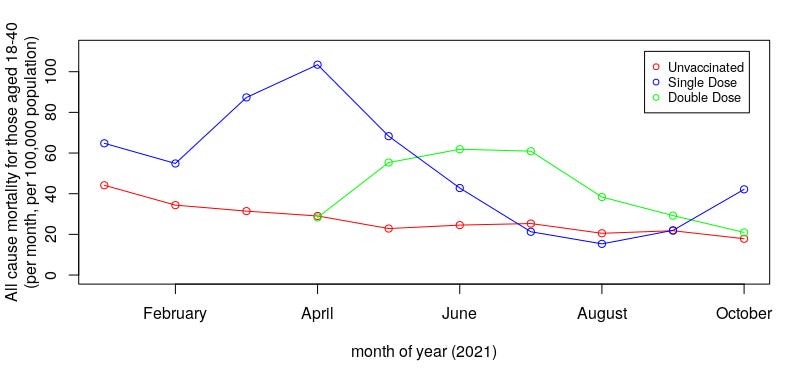
An important part of any analysis is how changes occur with time. Unfortunately, the data set we’re working with (latest update from the ONS on deaths by vaccination status) doesn’t offer so much granularity in the age groups in the by-month data, with the lowest age range available for those aged 18-40. Also, we are restricted to all-cause deaths, rather than specifically non-covid deaths, so it isn’t as clean a data set as we have been using in the previous two posts. Nevertheless, let’s see what the available data offers:
Well, there’s certainly enough there to discuss…
First of all, it is noticeable that all-cause deaths in those left unvaccinated is rather flat over this period, with only a slight increase during the significant covid wave in January and February 2021. There’s certainly very little increase in deaths in the unvaccinated during the Delta-wave of summer 2021.
There is a significant increase in deaths for the vaccinated groups.
This increase in deaths seems to correlate with the progress of the vaccination programme — a spike in deaths after the first vaccination in spring 2021.
And then a spike in deaths after the second vaccination in summer 2021.
It is possible that this is due to those most vulnerable being vaccinated (the opposite of the healthy vaccinee effect), however, as discussed in my previous post we still see a reduction in death rates in the 21 days following each vaccination, suggesting that those closest to death were being spared from vaccination even in younger adults (unfortunately the death rates for 21 days post vaccination are not readily available in the by-month data set, and so these data aren’t shown in the graph above).
Most concerning of all is that rise in the death rates in the single jabbed for September and October (blue data points to the right of the graph) — it would be bad enough if there was a risk period in the 2-3 months following vaccination, however, this rise suggests that the risk might remain for a longer period.
It isn’t clear why the risk of death should rise once more in the single vaccinated. I very much hope that this is not a sign of worse to come.
We don’t see this rise in risk of death in the double vaccinated — however, the shape of the curves suggest that there it is possible that there is just a delay of 3-4 months between the two data sets and that the risk of death in the double vaccinated will soon rise in a similar manner. Again, I very much hope that this is not the case.
Very interesting post. But wouldn't the rise in all cause mortality for the single vaccinated in September and October represent a new cohort of persons becoming vaccinated rather than the same cohort from earlier in the year? I can't imagine many would only get dose 1 and not get dose 2 nearly 6-9 months later
This appears to be the inverse of my next post (just finishing up the editing) on edge cases (ie. Serious comorbidities like cancer) creating the illusion of efficacy. Obviously, it is different in the vaccinated group as the vaccine might be causing edge cases rather than in the unvaccinated group where people may remain unvaccinated due to edge cases. In short, I would surmise that there is a possibility that there may be an even greater divergence in all cause mortality due to this phenomena if incidental edge cases are removed (which is impossible to observe without extensive investigation).